Volume – The Neglected Indicator? Find Out How to Use Volume
Full Review of the Volume Indicator for Binary Options Trading
There are various indicators you can use to measure volumes with but just how useful is volume and should you care about it? Well, analyzing volumes can tell us about the strength of a trend, reversals, breakouts and it can reveal false breakouts too. These are all important things that you should know before executing a trade. For this reason; learning how to interpret volumes can significantly improve your trading. Here is a short video on Investopedia that explains what volume is. Basically, volume is the number of shares of a stock, lots of a commodity or ticks of a forex pair that have been traded in a set period. This is not to be confused with net movement in a day. For example, Ford may trade over 30 million shares in a day which is not the same as moving up or down by a dollar.
What is the Volume Indicator?
There are four types of volume indicator in MT4 but for this we are talking about the simple volume histogram that shows the number of daily shares or tics traded. As you already know, there are both buyers and sellers in the market that push prices up or down; the volume indicator measures the number of shares traded without regard to buying or selling so for this reason is best used along with other indicators. When an asset is being traded volume is created; for price to move from one price level to another higher than average volume is usually required. For example; a rising market should also mean a rise in volume if the trend is to continue.
This indicator is usually used on assets other than forex because of the lack of official data in the spot forex arena. The volume you see when you look at a forex chart is actually tick volume as in the number of ticks that a pair has moved during the period, regardless of direction or extent. Think about it like this; the USD/JPY may move up by 40 pips/ticks net for the day but actually move 10,000 ticks during the day, both upward and downward. Fortunately, the correlation between tick volume and actual volume has been proved to be over 90% so it is okay to use tick volume for currency pairs.
How does the Volume Indicator Work
The volume indicators works by showing the number of shares of an asset, lots of a future or tics of a forex pair that have been traded during the indicated period. This is useful information because it reveals the amount of, or lack of, conviction in a price movement. This information can be used to confirm the move through price action and other indicators. There are a couple of main areas where I find volume to be especially useful but confirmation is the best. The way most traders use volume is with an average daily volume. If the average volume over the past 10 days is X and today volume is 2X, 3X or higher then today could be an entry point for trades.
Finding Reversals & Verifying Strength Using Volume
Monitoring the volume when price of an asset reaches certain support or resistance areas can tell you whether the trend will continue or a reversal will take place. Like I mentioned above; volume is required to move price. Meaning; if price makes a move but volume does not increase, it’s more likely that a reversal could occur soon. In turn, this also means that if a price rises or falls on high volume it has a higher probability of being a longer term movement. Exhaustion moves are also often accompanied by high volume and can be incredibly profitable trading opportunities as well. Of course, minor retracements can occur as buyers/sellers buy or dump their shares to make profit so it is important to use other indicators in tandem with this as well as price action/candlesticks.
Let’s take a look at the following example:
As price increases so does volume, indicating a strong trend. You’ll notice that retracements are on lower volume and the trend continuation is on much higher volume!
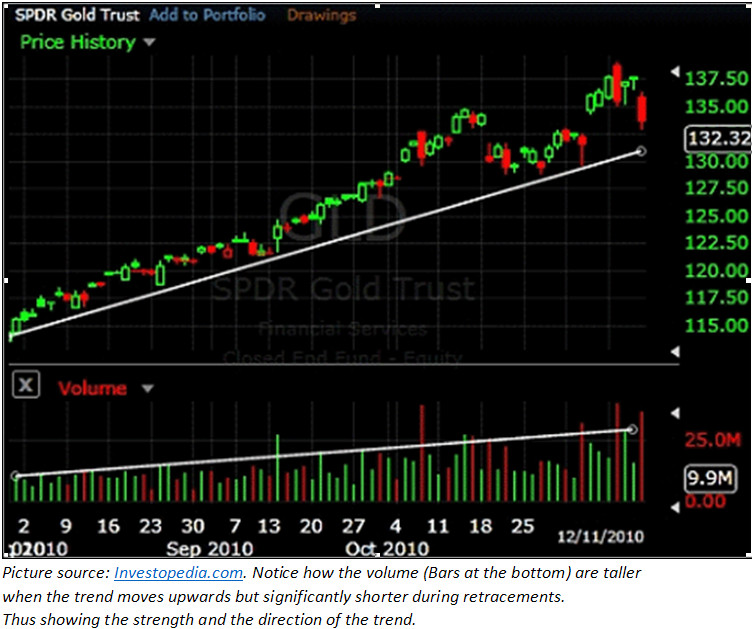
In the example above, you could learn two things by studying the volume indicator. First, that the bullish trend is still in charge and second, the small bearish movements are just retracements. Why? Because the volume is increasing as the trend moves up and those small retracements have lower volumes.
Why does the Volume Indicator Suck?
Just like any other indicator, this indicator can give false information and signals as well as good ones. Volume is a cold, heartless indicator and takes no account of direction or trend. Volume alone can’t give you precise entry signals so you have to apply other tools and methods to your strategy as well. Other than that, you should know that there are different types of indicators based on volume and each have their own drawbacks or advantages.
Why doesn’t the Volume Indicator Suck?
Volume can give you insight of what’s happening in the market and therefore it is a great tool and one that I highly recommend. There are several advantages with using volume such as locating reversals, confirming breakouts and identifying the strength of the trend but the very best use is for confirmation of other signals. Using price action together with Volume is a great way for newbies to start trading.
Turn Up the Volume, Listen to the Market!
I’ve mentioned just some of the benefits that come with using market volume but there are many other benefits and tools based on volume. I’m sure that you can see it adds great value when analyzing charts and it has the potential of minimizing risks and increasing accuracy if used correctly. There are a variety of indicators that are volume based and some can already be found in MetaTrader 4 such as the Accumulation/Distribution indicator . It is wise to use volumes with price action and in accordance with trend analysis. If you still have questions about how to take advantage of volume trading and want more examples, visit the forums and be sure to let us know if you have your own way to use this tool.