Trend Line and Chart Patterns Strategy – Trading Safely With the Trend!
Full Review of the Trend Line & Chart Patterns Strategy for Binary Options Trading
I found this interesting price action forex strategy on the website forex-strategies-revealed.com among their advanced list of strategies. It caught my attention because the author, Azim, claims that with this strategy he focuses only on quality trades and ignores quantity and I like his way of thinking. Even though this is an advanced strategy, the idea behind it is simple and we don’t need to install fancy indicators or waste time adjusting the periods and levels. In fact, all we need is some knowledge about chart patterns and a platform that allows you to draw trend lines. I guess the only questions is whether this strategy can be profitable for binary options trading or not? Let’s take a look!
How Does the Trend Line & Chart Pattern Strategy Work?
What you need is a chart with candlesticks, after that you can choose any major currency pairs you wish, according to the author. And he even suggests using higher time frames. The higher the time frame, the more accurate the signals will be! Since the author uses the hourly chart in his demonstrations I’ll stick to with that for this review.
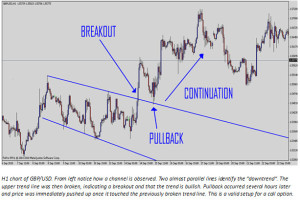
Once the H2 chart of your favorite currency pair is up and running, simply locate a trending channel. It means that you need to look for lower highs and lower lows that can indicate a downtrend or higher lows and higher highs to recognize a prevailing uptrend. Connect the lows and highs with trend lines and then wait for a breakout with confirmation. You need to be patient here, the breakouts themselves are not the signal, what we really want is a pullback and confirmation of the trend line that was recently broken. As soon as the broken trend line proves to be a solid support or resistance level we can enter a trade.
Entry Rules:
Call Option: Identify a channel, look for a breakout through the upper channel-line, wait for a pullback and as soon as the line acts as support you can enter a call option.
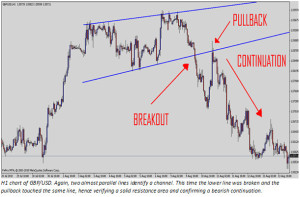
Put Option: Identify a channel, look for a breakout through the lower channel-line, wait for a pullback, as soon as the line acts as resistance you can enter a put option.
What about the Expiry?
Usually, when it comes to forex strategies, there is no mention of how to choose the right expiry but in this strategy, Azim, the author suggests we calculate the size of the channel. Even though it was meant for picking profitable targets for forex trading we can still apply this method to binary options trading. I suggest you do this by looking back and calculating an average time for the highs/lows in the channel to get an approximate idea of how long it might take for a new low or high to form. This way you’ll have a better chance of giving the trade enough time to move towards the desired direction.
Why does the Trend Line & Chart Pattern Strategy Suck?
First issue I have in mind is all the waiting parts; waiting for a channel, waiting for a breakout, waiting for a pullback and finally waiting for confirmation. Having said that, I believe you can apply this strategy to lower time frames in order to get more signals, with the risk of increasing the number of false signals. Second issue is that even if we’ve confirmed a pullback and support or resistance seems to be holding we can still not be entirely sure the move will occur anytime soon. After the pullback, the price might stay in indecision with low volatility for several hours or worst case scenario; several days. This can make choosing expiry tricky.
Why The Trend Line & Chart Pattern Strategy Doesn’t Suck
Simply because this method of trading is an awesome price action strategy! Your only indicator is the price itself and you are totally independent of lagging or leading indicators. Furthermore, with the trend lines you make sure you stay with the trend, hence minimizing your risks. What is absolutely awesome possum about this strategy is that it is applicable on basically any time frame you wish to work with and the higher the more accurate it gets. By the way, another positive fact: not comfortable with the no indicator situation? Go ahead and add a couple of EMA’s and maybe Stochastic Oscillator and it won’t ruin the strategy.
Conclusion – Trade like a Pro!
Allow me to make this clear: this strategy is a great way of analyzing the market. This is how the pros trade! You don’t want to clutter your charts with millions of indicators but as I said before, if it gives you comfort, then you can add one or two to help. I recommend this strategy for more experienced traders as you are required to have some candlestick, chart pattern and trend line knowledge to make this work. Remember that we are meant to look for quality trades, not quantity, that means you need to wait for the “perfect” setup. If you don’t have the patience to wait for the long term trades take long term trades with higher investment amounts and then use the lower time frames for short expiries with lower investment amounts. This way you will spread out your risks and get to trade more often.