The Williams A/D Line Indicator for Binary Options
Accumulation and distribution are the two driving forces of market action. Yes, yes of course fear and greed are in there too but those are emotions that lead us to accumulate or distribute stocks, bonds, currencies, commodities or any other tradable asset. Accumulation is a measure of buying, distribution is a measure of selling; it only makes sense that a study of these forces could have a significant bearing on your trading. Like with all theories, there are several different indicators and tools designed to reveal the strength of these forces. One is the Accumulation/Distribution Line, developed by Mark Chaikin, another is the Williams A/D Line indicator, developed by Larry Williams of the Williams %Ratio fame. While similar, the two are not the same; Chaikin’s version takes volume into account for one thing, Williams doesn’t.
Full Review Of Williams A/D Line Indicator
Williams A/D Line Indicator is a one of a host of accumulation/distribution based indicators. It is similar in calculation to Chaikin’s A/D line as well as On-Balance-Volume with one significant difference, it does not use volume in the calculations. Williams A/D line is based purely on price action and compares today’s close to yesterday’s close and is a sum total of positive or negative advance in an asset. In essence what it is doing is measuring market pressures, buying and selling. The tool works best with divergence and is a trend following indicator. As prices rise so too will the A/D line, when they fall so too will the A/D line. It is the relationship of peaks and troughs within and between price action and the A/D line itself that provide insight into the market.
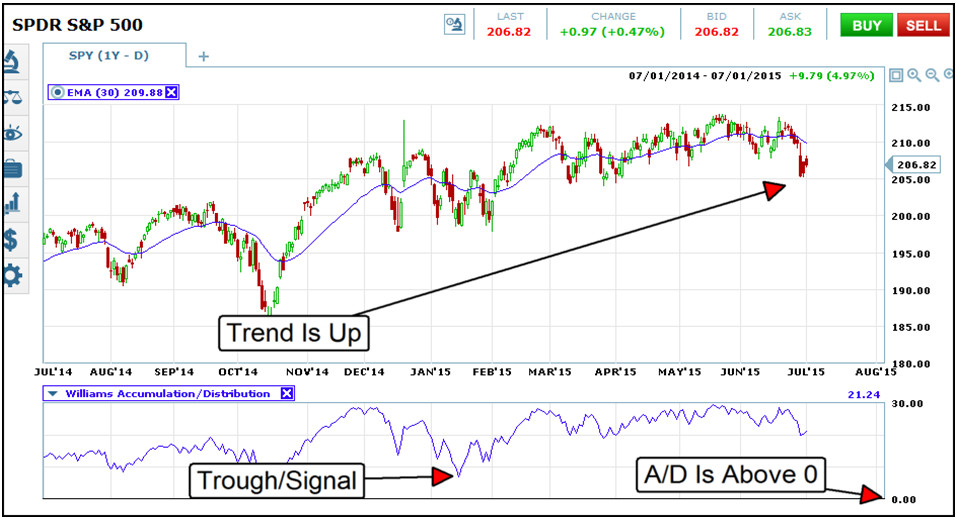
As a trading tool this one has two indications. The first is trend. When the A/D line is moving higher the market is trending higher and vice/versa. The second is divergence. When the market makes a new peak or trough while the A/D line moves counter to that move it signals divergence and potential reversal. The indicator is an oscillator in effect, ranging above and below the 0 line with no upper or lower limits. When it is trending higher it indicates trading only calls, when it is moving lower only puts. The Williams A/D line, unlike the more standard Chaikin version, produces a choppy line that can be used to produce day to day trading signals for binary options. When the A/D line is trending higher and makes dip that is a signal for calls, the same is true in reverse for puts. Ranges can also be traded in this manner but come with added risk of whip-saw and false signals.
Why The Williams A/D Line Indicator Might Suck
This indicator might suck for a couple of reasons. First, it excludes the addition of volume which I think is a very important factor in any trading environment. Another is the basic use of the indicator, looking for trend and potentials reversal. In terms of trend do you really need an indicator to reveal trend? Can’t you just look at a chart and see that an asset is moving higher over time, lower over time or sideways over time? In terms of reversal and divergence these signals can be powerful and are a good warning sign but aren’t really tradable in and of themselves, you have to have some other confirmation to go with it.
Why The Williams A/D Line Indicator Doesn’t Suck
This indicator doesn’t suck even though I was pretty skeptical of its use at first. While I think its use as a trend tool is overrated, and its use as an indication of reversal is hard to trade it does provide some good clear trading opportunities that bear further testing. The Williams A/D line is much more choppy than the Chaikin model and responds to changes in price action much more quickly. This volatility results in some pretty good signals for trend followers but the quality is reduced the lower in time frame you go, I recommend no shorter than 1H with 1D, 4H and 2H the best choices.
My Final Thoughts On Williams A/D Line Indicator
I like this indicator, I am intrigued and will be testing it further. The indicator makes good use of price action and produces a line that I think can be used to generate good signals for traders. The caveat is that it is not a great tool for really short term traders like 60 seconds or even 15 minute or 1 hour options. At these time frames the line becomes too choppy and difficult to read, unlike on the higher time frames where swings indicates higher probability movements with minimum durations of 3-5 candles. At this time I will recommend this tool for advanced traders only.