The IchiBress Strategy – Extreme Market Turning Points
When it comes to binary options, the lack of a strategy is not a real problem. Nah, you can find a strategy on almost any website geared towards trading, you can find strategies on forums, heck even brokers offer you strategies, although those are very basic and poorly explained most of the times. You have tons of strategies, but the real challenge is finding one that is at least decent and that suits you. Only you can decide if IchiBress is for you, but for that you’ll have to read it first.
What is IchiBress and how to use it?
IchiBress is the combination of 2 indicators: Ichimoku and Bressert Scalper. Yea, sorry but today I lack the inspiration to come up with some long or complex name for it, so I figured IchiBress has to do it; after all, if you like the strategy and make money with it, I believe the name is of little importance. Ok, getting down to business: you will need the always present Meta Trader 4, the Ichimoku indicator, Bressert Scalper (available at the bottom of the page) and a Traders Dynamic Index for confirmation. To learn more about these indicators, follow the links provided, or just go with the flow and finish reading this article – you don’t need in depth knowledge about the 3 indicators to trade this strategy. The new kid on the block is Bressert Scalper; this one is derived from the DSS Bressert which in turn is derived from the Stochastic (DSS stands for double smoothed stochastic). Yea, I know it turns into a soap opera where everybody is related to everybody. Let’s snap out of it and see a picture:
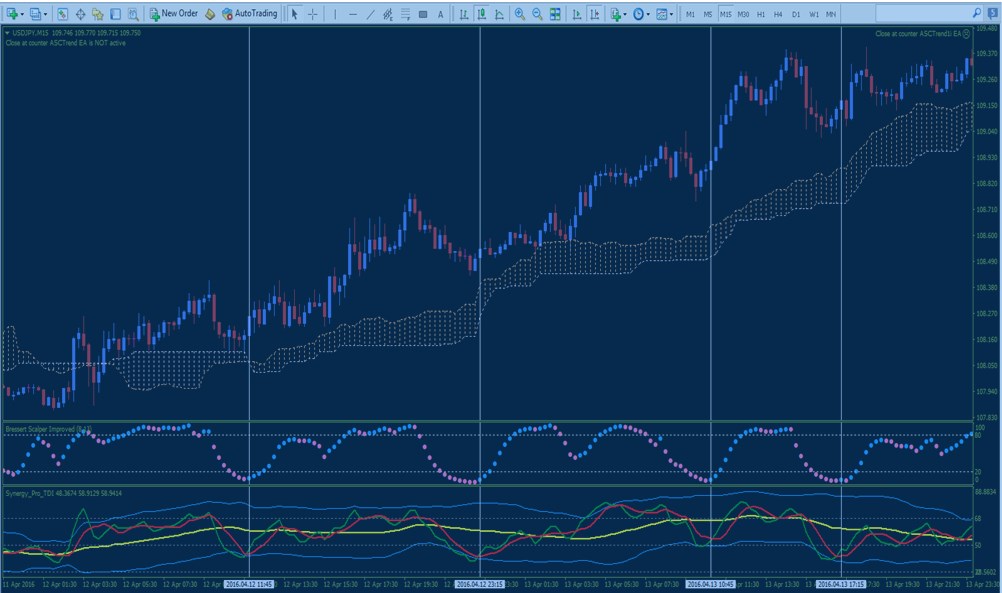
The indicator that overlays with price is the Ichimoku. By default this indicator has other lines as well but for this strategy we will only use the cloud (what you are seeing on my chart is the cloud only) so please go ahead and change all colours of the other lines to “None”. We need price to trade clearly above or below the Ichimoku cloud!
In the first indicator window we have the Bressert Scalper. This is a pretty straightforward indicator that shows overbought (above 80) and oversold (below 20). We will only trade when the indicator shows an extreme condition!
The third and final indicator (bottom window) is the TDI. I am not going to explain here what this indicator does but if it tickled your curiosity, just follow the link I gave you earlier and read the full explanation. For this strategy we will wait until the Green or Red line (or both) have touched the volatility bands and they started crossing in the opposite direction. Just watch the pic again and you will understand. This behaviour of the TDI will confirm the Bressert overbought or oversold. Let’s say the Bressert goes above 80. This overbought condition is confirmed by a touch of the upper TDI band. If the Bressert goes below 20, this oversold condition is confirmed by a touch of the lower volatility bands on the TDI. Let’s recap:
Trade Rules Summary:
Call trades
- Price is trading Clearly above the Ichimoku cloud
- Bressert Scalper is Oversold (below 20)
- Red and/or Green lines of the TDI have touched the lower volatility band (Blue) and have crossed upwards.
Put trades
- Price is trading Clearly below the Ichimoku cloud
- Bressert Scalper is Overbought (above 80)
- Red and/or Green lines of the TDI have touched the upper volatility band (Blue) and have crossed downwards.
Recommended time frame – 15 minutes
Recommended expiry – according to market conditions
Why IchiBress Doesn’t Suck?
I like getting double confirmation on everything and I like how Bressert and TDI work together. I use these two indicators on my charts currently and I learned to tell with decent accuracy when they lie and when they tell the truth. Most of the times when both agree (both show oversold or overbought at the same time), price starts moving in the indicated direction. Then you have the Ichimoku which is a great trend indicator and by trading only when price is clearly above or below it, you make sure you are on the right side of a trend.
Why IchiBress Sucks?
Since this is a trend following strategy, it has a clear weak spot: the end of the trend. Usually most false or bad signals come when the trend is about to reverse and price goes through the Ichimoku cloud. To avoid this, I recommend to take only the first few signals in a new trend. Also, trading should be avoided when the Ichimoku is thin and without a clear direction. Look for it to be nicely angled, not drifting without direction.
The Verdict – Should I Use IchiBress?
Yes, you should. On Demo! I use something very similar and it works for me but you should first test this strategy and see if it suits you. My clear opinion is that you should never use a certain strategy simply because someone says it’s great. Put in the work and backtest it first if you plan on using it with real money. On paper it looks good: double confirmation and following the trend, but in practice things can be a bit different. That’s why I say you need to test it and learn its ins and outs. Hit me up on the Forum for any questions you might have.
Download Available: