Okane’s HomeGrown Price Action Strategy for EUR/USD
HomeGrown Trading: Okane’s EUR/USD Binary Options Price Action Strategy
Okane’s home grown EUR/USD price action strategy for experienced traders! Use support and resistance lines and time pattern to trade EUR/USD profitably.
Finally the time has come for me to share the strategy that I have been using on my live account for the past 6 months or so. I named it; ‘Okane’s Price Action strategy for EUR/USD’ because everyone uses Price Action in a different way and I don’t want to start a war on whether this is a PA or not…it’s my strategy and this is how I trade. This is far from a mechanical strategy and it’s absolutely no good for beginners, you’re gonna need some experience to make this one work, there aren’t any magical blinking arrows and there’s only one indicator… unless you want to call the clock an indicator. If you are familiar with using support and resistance lines, can recognize trends and understand candlesticks then keep reading and you might be able to use my strategy. Those who enjoy trading short expiries such as 10-20 minutes on EUR/USD can benefit from reading this review whether they choose to use my strategy or not.
What Is Okane’s Home Grown EUR/USD Price Action Strategy?
This strategy uses Stochastic Oscillator, price action and the clock to predict possible trend retracements. I use stochastic with standard settings, (5, 3, 3) with signal levels marked at 20 and 80 to confirm signals that occur near or on my lines. Start by drawing horizontal trend lines, also known as support and resistance lines on your charts. Higher time frames are preferred, such as H2, H4 and even the daily or above because they are more reliable. You should be confident at drawing lines, tell which lines are significant and why they are stronger than others. In my experience, the strong support and resistance lines are the ones drawn on higher time frames, areas that have the most “candle bounces” or thickest price action. Personally, I prefer to have two charts open simultaneously, one M5 and the other illustrating H1. The chart set on a higher time frame is practical to have because you can clearly see if price is heading towards a major support or resistance line. When price is trending and gets near a S/R level I watch the clock and Stochastic to get my signal.
The super-secret Guru part of the strategy that takes experience to master is timing the signals. This is where the clock comes into play. To help make it clear just look at a EUR/USD 15 minute chart, choose the cross hair (on MT4) and hover over full hours and half-hours. It should become clear that retracements in this pair occur at nearly every hour and half hour of the trading day. What I do is look for a potential retracement each time the clock approaches one of these times. This can presents up to 48 possible trading entries every day but we don’t want to trade all of them because sometimes price ignores this time pattern. The Oscillator’s purpose is to provide additional confirmation by identifying overbought and oversold levels as well as highlight potential support and resistance, ie the actual signals. Sometimes the signal is trend following and sometimes it isn’t. Obviously, we want to trade the retracements where one of our support or resistance lines are touched and confirmed with the Stochastic Oscillator. The best signals are catching the trend following entries after the retracement but the retracements can be traded too.
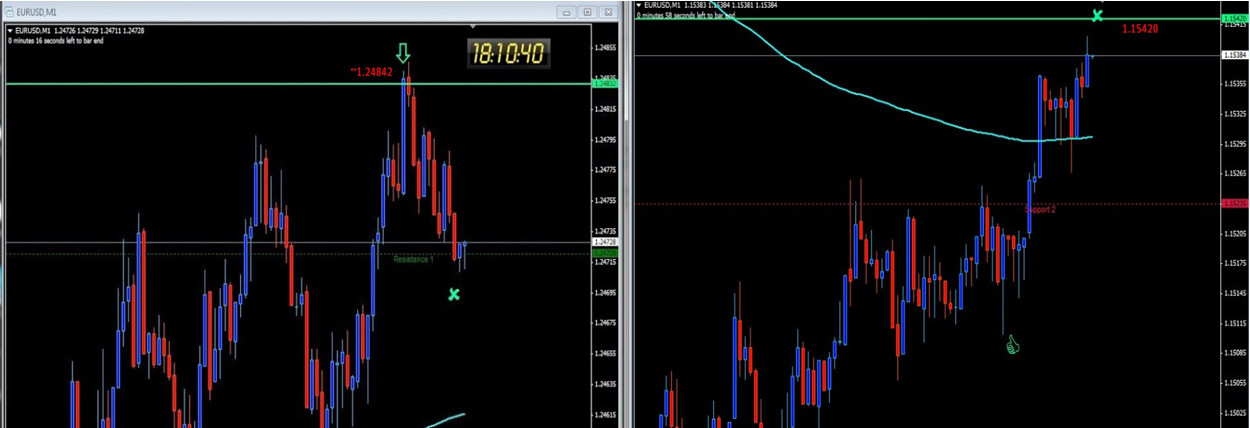
On the left: Put taken at almost 1.24842 at 17:59 and expired 18:10. Notice how it is moving back up after 18:10. Also, Stochastic indicated overbought on most timeframes. On the right, this was actually a touch option because price was moving up and trying to break the dotted red line repeatedly and I figured it wanted to reach to or near 1.15420 which it did! Stochastic on the M5 would get oversold very quickly each time price dropped.
Incase you still work your way around Price Action, here’s a short how to video:
Why Does My Strategy Suck?
My strategy sucks if you haven’t spent a lot of time watching and trading EUR/USD. Generally speaking; my strategy sucks for anyone who is not fully confident in drawing trend lines and S/R lines and is not in touch with this market. Furthermore, the time patterns are sometimes totally neglected and our expiry is so short that a small mistake can result in a few pip disadvantage which in turn could mean a losing trade. Getting a good entry and expiry can be crucial and time is not an indicator on its own.
Why Doesn’t My Strategy Suck?
This strategy doesn’t suck because after testing my strategy live during six months it gave me roughly 62% ITM on >200 trades. The two first testing months obviously lowered the win rate because it was new to me as well but once I got the hang of reading the chart according to the time my success improved. It also doesn’t suck because it does not rely much on any indicators, even though I use Stochastic it is merely for extra confirmation. I take patterns and trends into consideration and base my signals accordingly.
Conclusion – Will it Work?
My strategy works for me and it can work for you, but is an advanced technique. I have only tested it on the EUR/USD, if you want to use it on a different pair you will have to test it like I did for a few months and see for yourself! That’s why I call it ‘Okane’s EUR/USD strategy’ and not Okane’s “Every asset you wish strategy”. This review might leave some of you confused but strategies based on experience can’t be taught so easily. Luckily, we can discuss as much as you want in the forums and I can help you understand how to apply it and share more super hidden secrets =). You will also find some trades with more information in my trading diary here.