Linear Regression Curve Indicator – Trade the Retracements
Full Review of the Linear Regression Curve Indicator for Binary Options
Full review of the Linear Regression Curve Indicator – Identify the trend and trade the retracements.
Linear regression Curve is a statistical method for identifying price trends. It may sound complicated but relax, you don’t need to dust off your old statistics books to use it. Let me put it simply, the linear regression indicator draws trend lines. This indicator measures price and time and looks very similar to a moving average. Since price is practically scattered all around the charts, the linear regression tool draws the “best fit” line, also known as the “least square fit” line. It means that the ‘band’ you view on your charts is as closest as possible to those scattered price points, statistically. Relying on statistical values is considered a quite reliable method by Forex traders but will it be as useful to us binary options traders?
What is the Linear Regression Curve Indicator?
Linear regression analysis is based on a line dependent of time and price, in fact, you might remember this equation or a similar one from primary school:
Linear Regression: Y = a + bX + u
There are two types of linear regression tools. One is based on3 lines, called the channel regression, and the other is a Least Square Moving Average, LSMA. The latter plots the end points of a linear regression line that is recalculated each day. Each days end point is then shown on the chart, producing the curved line that you see. Therefore it’s called the Linear Regression Curve indicator and it’s the tool I am addressing in this review. Unfortunately, you can’t find the curve indicator in MetaTrader 4. You can however, download the indicator and install it manually.
The linear regression curve can be used to identify the direction of the trend and its strength.
Unlike a moving average, linear regression does not average the price but rather adapts to highs and lows. It shows, statistically, where price should be. You could say it’s more of a leading indicator. We can use this data to find deviations from the statistical patterns and find longing/shorting opportunities based on extremes. The line in effect represents where prices are likely to return to when at an extreme level.
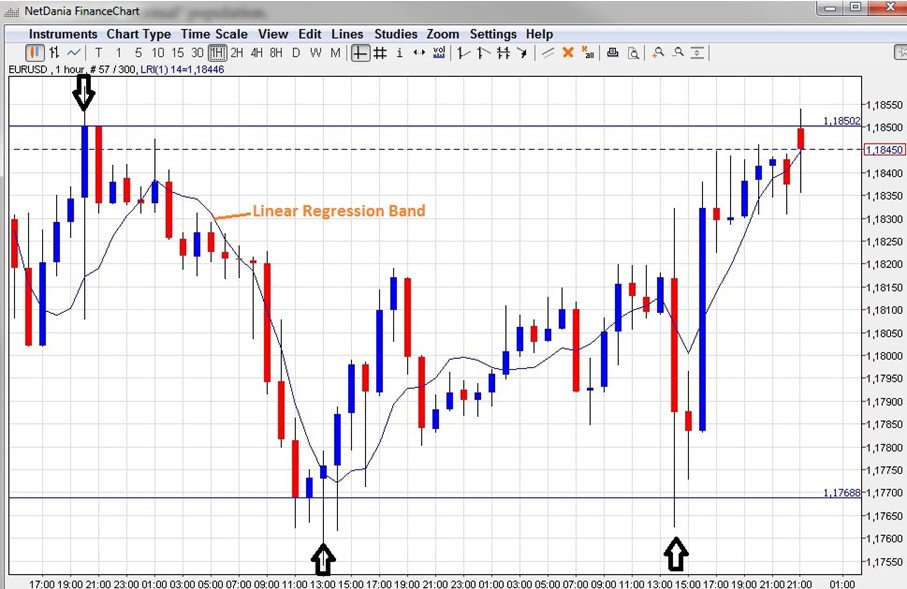
This is H2 chart of EUR/USD with Linear Regression indicator included. Notice how price deviated significantly from the regression band 3-4 times and then jumped back and got close to the regression band again?
The picture above demonstrates how well linear regression works in harmony with the price. Once price deviated significantly from its regular levels it had to eventually get back to the regression curve. These are the opportunities for us traders to enter a position, call or put. As I said before, the indicator is strong when it comes to showing the direction of the trend so it would be wise to stick with the main trend and trade the retracements only. Rules of entry: Enter calls when price significantly drops under the linear regression band. Enter puts when price significantly rises above the linear regression band.*
*Obviously, it is difficult to know what “significantly drops/rises” means and these rules assume you are following the underlying trend. Other indicators or technical analysis are of course recommended. To find out more about how you can fully benefit from this tool, please continue the discussion in the linear regression thread in the CommuniTraders forums.
Why Does the Linear Regression Curve Indicator Suck?
The regression indicator by itself is not enough and will probably give you fake signals now and then. As usual, timing is an issue, because knowing that price is supposed to come back to the regression band is one thing, but knowing WHEN is a challenge. You can’t know how to set the expiry solely based on this indicator. Price might continue in one direction, away from the regression band, for a long time before it comes back again and setting up the regression curve to different periods results in very different outcomes. A higher period could signal a downtrend while a lower period signals an uptrend. This could be very confusing – especially for beginners.
Why Doesn’t the Linear Regression Curve Indicator Suck?
The trend is always your friend and determining its direction is one of linear regressions best properties. Together with other analytical and technical methods the regression curve could prove to be a strong and beneficial tool. Furthermore, in the business of trading, relying on statistical analysis is smart. Traders move the prices and they are predictable. Historical statistics can thus reflect which direction those traders probably will move the price towards.
Conclusion – Statistics Don’t Lie!
With the linear regression curve indicator, the odds are in your favor! Identify where the trend is strong and take advantage of significant deviations from the typical price. History does repeat itself and as traders we want to be there when it does. Combine other analytical methods such as support and resistance lines, stochastic indicator or other tools to create a powerful strategy with the help of the linear regression curve tool. Choosing expiry and finding a period that is suitable for this indicator can seem troublesome but, as with any other tool, you need to test it on the time frame of your strategy. In conclusion; the linear regression indicator can indeed be useful to us binary options traders. I will review the channel tool in my next review so stay tuned! By the way, don’t forget that you can continue the discussions in the forums!