Linear Regression Channel Tool – Identify the Trend and Trade the Deviations
Full Review of the Linear Regression Channel Binary Options Tool
Before you read this review you might be interested in reading my previous review about the Linear Regression Curve indicator. The Curve uses regression to form an indicator similar to a moving average. The regression channel is different, it’s not really an indicator but rather a tool, based on three slopes. While the curve indicator shows where price statistically should be, the regression channel shows price deviations. This tool is used by Forex traders to project where extremes may be and binary options traders can adapt it to their strategy as well. I have tested this tool a couple times and I am already impressed by how accurate a few “simple” lines can be. Yes, even an elementary tool like this can be helpful.
What is the Linear Regression Channel Tool?
The linear regression tool can be found in MetaTrader 4. It is not an indicator so you won’t find it under indicators. Go to Insert à Channels à Linear Regression. Draw the lines from a starting point, a bottom of a candle and upwards or at top of a peak and downwards, depending on the direction of the trend. The equation for a linear slope is; Y = Kx + m. As you might already be familiar with. In our case, Y is the price and x is time. Hence, the linear regression channel depends on historical data based on time and price. You can read more about regression analysis here in my article about the regression curve tool.
Allow me to illustrate with the picture below:
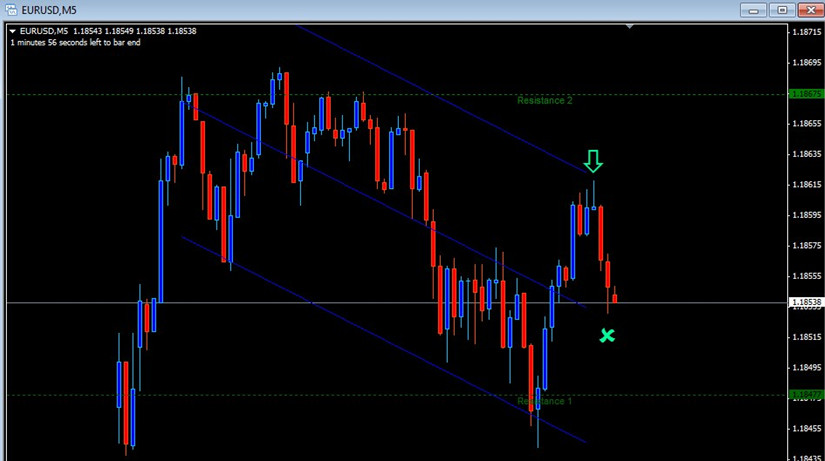
A put option was executed when price touched the outer deviation line because price “had” to retrace back to the center linear regression line. Notice that price was falling after hitting the resistance 2 line so I went with the trend after bulls no longer were in charge.
As seen above, the linear regression channel consists of three slopes where the outer lines are indicating price deviations. Price breaking out of this channel could signal a possible reversal. These lines can act as trend lines too, showing which direction price is heading or when a deviation line becomes the next support or resistance. I would like to point out that Bollinger Bands ™ are also based on price deviations but form a moving envelope rather than channels. You can apply these lines on the time frame of choice and start historically as far back as you wish. When price breaks out of your regression channel and makes new highs and lows, it’s time to insert yet another regression channel or readjust the old one.
Why Does the Linear Regression Channel Tool Suck?
This tool by itself is not enough to base your signals on. The channels can be broken at any time, resulting in fake signals. Just because price should get back to the center line it does not mean it will always do so. New trends can arise and price can head to the direction it wants. Further confirmations are therefore necessary in order to make this tool trustworthy. Other than that, there aren’t many issues besides that drawing and adjusting the lines can be challenging for beginners.
Why Doesn’t the Linear Regression Channel Tool Suck?
We already know trend lines are a trader’s friend, but trend lines that also show you price deviations are even better! The linear regression channel not only shows you where price is heading but also signals breakouts, retracements and over-exceeded movements. You can, for example, identify when fundamentals have pushed the price far beyond where it statistically should be and hence, prepare for a push back towards the center line.
Conclusion – Go with the Statistics!
After testing this tool in combination with my own support and resistance lines and confirming overbought/oversold positions with Stochastic I came to the conclusion that linear regression channel is an excellent tool. In every trial case the deviation lines were in line with my ow support and resistance, providing me with extra confirmation that a reversal could be expected. My caveat, you should also rely on more than just the regression channel tool. By itself it is not a complete and reliable strategy. However, if I had to choose between the linear regression channel and the regression curve I think I would prefer the channel tool. Of course you would have to test it and adapt your strategy thereafter. Only then you can conclude which tool/indicator works best for you. For beginners the curve indicator might be easier to use since you don’t need to draw anything on your own. In my opinion however, the regression channel provides more information about what to expect from the market. You know what, let’s discuss this and more in the forums!