Japanese Candlesticks Series – 6 Bearish Candlestick Reversal Signals
In our ongoing effort to bring the best information on trading to you, the binary trading public, we have compiled this list of the top bearish candlestick reversal patterns. It is part of our series which began with the articles Japanese Candlesticks- Trading Naked, continued in Japanese Candlesticks The Sequel and rounded out with How To Read Candlestick Signals. In this installment I will be going over the best bearish reversal patterns known to the market. These signals only occur in up trends and at the very minimum reveal support levels, and at the very best indicate the end of a bullish trend and the start of a new bear trend. When used along with other confirming indicators such as support/resistance, stochastic, RSI, moving averages or Fibonacci Retracements they become very strong and will help you cut profit out of the market the way a samurai sword cuts flesh.
Definition of Reversal Signal – A reversal signal is one that indicates a trend is losing momentum and reached a turning point. In this case the signals are bearish and occur only in an uptrend. The signals gain strength when the trend is strong as in a long term trend versus a short term trend, and when they occur near a known or otherwise indicated resistance zone. For best effect they should be used as an indication a signal is coming and only traded upon confirmation. One thing to remember, a reversal in trend does not neccesarily mean from bullish to bearish, or bearish to bullish. It can mean from bullish to sideways, or sideways to bearish.
Types of Bearish Candlestick Reversal Signals
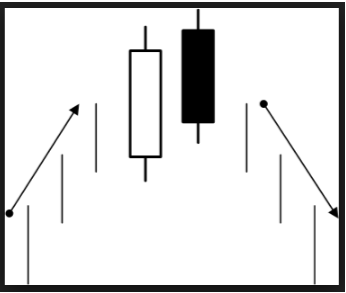
1. Bearish Engulfing Pattern
This pattern is exactly the opposite of the bullish engulfing pattern. It occurs at the top of an uptrend and includes two candles. The first will be a strong or relatively stong white candle, indicating that bulls are still present and trying to push higher. The next candle will be long and black, open above the close of the white candle and close below its low. The black candle shows that bears are present at this level, the size and scope of it that the bears are more numerous and stronger than the bulls.
2. Dark Cloud Cover
This pattern is very similar to the engulfing pattern but not quite as strong. Keep in mind that this pattern, like all others, gains strength when the candles involved are noticeably larger than the average candle that appears on the chart. It starts with a strong white candle, moving to a new high at or near to a resistance area. The next candle will be long and black, opening above the top of the white candle and moving lower, but not engulfing it. For best results the candle should close in the lower half of the white candle, otherwise it is known as a bearish piercing patterns and loses some of its significance.
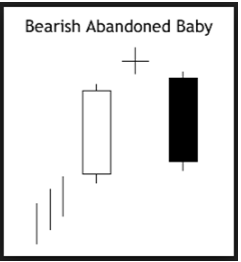
3. Abandoned Baby/Evening Star
This is another bearish pattern with an identical counterpart for bullish trading. It also has more than one name, two of which I have shared with you today. It occurs at the end of an uptrend, near resistance or once momentum has exhausted itself, and indicates a change in trend. This patterns involves three candles. The first will be bullish, moving up to a new high or just short of a new high. The second will be a very small candle, either black or white, that may be a spinning top or a doji (if spinning top usually called abandoned baby, if a doji often called evening star) that gaps up at the open and does not move lower to close the gap. The third candle will be a bearish candle that opens lower, and moves lower with a close near its bottom. The middle candle is the baby, it may refer to a “baby” break out, and the second move shows the market abandoning it as the bears take control of prices.
4. Shooting Star
This pattern can be considered to have three candles but it is the middle candle that carries the most importance. The first candle will likely be bullish, moving higher within an established uptrend. The next candle will open near the top of the first, move strongly higher, and then fall back to close at or near the opening price, creating a doji. The third candle will confirm by moving lower. For best results the middle candle, the doji, should be long legged and come with high volume. It signifies the bulls have tried to advance past resistance, nearly made it, but were then repelled by the bears. The third candle confirms the bears are in control. This pattern is also common to standard H-L-C charts and know as a Pin Bar or Pinochio by westerners.
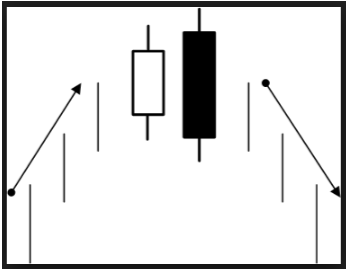
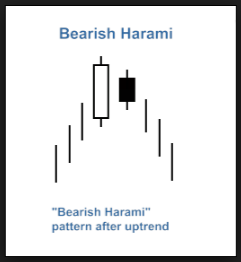
5. Harami Pattern
The Harami Pattern is also found in bull and bear markets. The bearish version occurs at or near a peak or top in an uptrend. The stronger the up trend, the stronger the signal. The pattern involves two candles, the first is a long bodied white marubozo, the second is a spinning top or small doji. The second candle will form completely within the body of the first candle and its position relative to the mid-point of the marubozo is very important. If it appears in the top half of the marubozo it is less strong and may merely indicate a market pause. If it occurs nearer the middle, or even better, in the lower half of the marubozo it is much stronger and indicates that the bears are overpowering the bulls. You can read more about this pattern here, Harami Pattern – Cut Like A Knife.
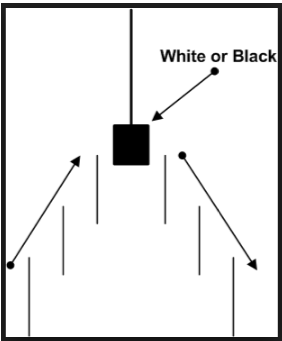
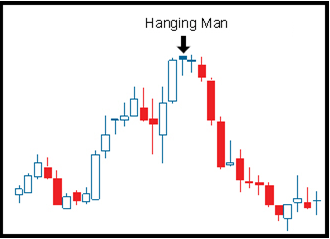
6. The Hanging Man
The Hanging Man is a strong doji signal that can appear at the top of an up trend. The signal forms when a bullish candle is followed by a gap up that does not move higher. Instead, bears push prices lower, closing the gap opened with the candle, and then move up to close at the opening price. It is confirmed with the next candle if it moves lower, or at least does not move higher than the top of the doji. Like all doji, the strength of this signal is dependent on the size of the doji, more specifically the length of the lower shadow. The longer the shadow, the stronger the signal.
Further Reading On Japanese Candlestick Signals