Japanese Candlesticks Series – 7 Bullish Reversal Signals
In a previous article, 7 Bullish Continuation Patterns, the patterns were to be expected and traded in an uptrend only. This time, the patterns are to be found in a downtrend and precede a shift in direction, to the upside. I recommend that you have an understanding of trend lines and chart patterns and basic candlestick knowledge beforehand. If you are not familiar with Japanese Candlestick check out our article, Japanese Candlesticks- Trading Naked.
Types of Bullish Reversal Signals
1. Bullish Abandoned Baby
In a downtrend, look for a Doji candlestick right after a relatively long bearish candlestick. This Doji should appear with a gap below that bearish candlestick. The third candlestick is a relatively long bullish candlestick that should have opened with a gap above the Doji with no overlapping on the Doji’s wicks. This formation is called the bullish abandoned baby. The chances for the market to open with such a big gap is higher at the beginning of the week or at the beginning of a new market day.
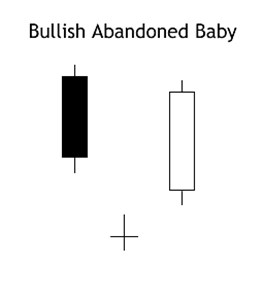
The “baby” is the Doji which is abandoned by the two longer candlesticks.
2. Bullish Breakaway
This next Japanese candlestick formation consists of five candlesticks. Four of which are bearish. Once again, the market is in a downtrend but it is getting closer to a support line and therefore, the bearish candlesticks are losing momentum as fewer bears remain in the market. The first bearish candle is relatively longer and it’s followed by three smaller bearish candles that each end closer to the support. The fifth candlestick which is a bullish one, opens higher than the last bearish candlestick and closes near or close the first long bearish candlestick – Indicating that the bulls have reentered the market in strength.
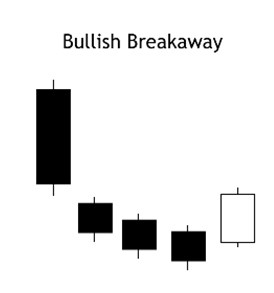
Price is slowing down, the bearish candlesticks have lower volumes and the bulls enter the market on the fifth candlestick, closing above the three bears.
3. Bullish Ladder Bottom
This candlestick formation also includes five candlesticks and is found in a downtrend. Price is approaching a support with three relatively long bearish candlesticks, possible a Three Black Crows Formation. The fourth bearish candlestick will have a long wick on the upper side, resembling an inverted hammer as the bears managed to push down the once bullish candlestick. The fifth candle should open with a gap above the inverted hammer and close near the high of the first black candle.
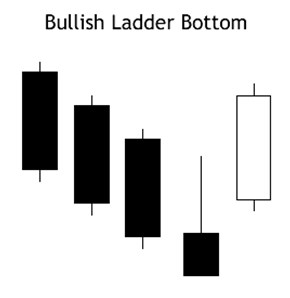
Notice the inverted bearish hammer and the bull candle are distanced with a gap and the bull candle has a relatively large volume, closing near/over the last 2-3 bear candles.
4. Bullish Three River Bottom
A bearish candlestick is nearing a support, the next bear candlestick reaches the support but is then pushed up to become a bearish hanging man/hammer candle. This is due to bulls pushing the price up from support, hence showing that bulls are ready to enter market and challenging the strength of the bears. The third candlestick opens near the beginning of the bear candles shadow, near support. It closes bullishly but under the body of the hanging man candlestick. After this the bulls should be in charge, and will likely lift the price into a new up trend.
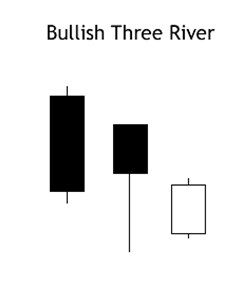
Support seems strong, proven by the long candlewick attached to the hanging man. The next candle is bullish – this is where the bulls have entered the market.
5. Bullish Gravestone Doji
This pattern consists of two candlesticks only. When approaching support, a bearish candlestick is followed by a bearish Gravestone candle. The bears fought the bulls with their last breath, pushing the candle down and hence, created that long wick. This pattern is also very good at identifying possible support levels. Obviously, it is wise to further wait for a third and bullish candlestick to confirm support!
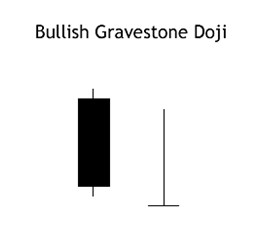
Wait for a confirming bullish candle after the gravestone.
6. Bullish Engulfing
This one is a classic. You will hear people talking about it and see it quite often on the charts.
Engulfing means: ‘to surround or to cover something completely’. In this case, it’s the white and bullish candlestick that engulfs the previous bear candlestick. This is because we are talking about a bullish engulfing pattern. This occurs after a down trend when a bearish candlestick closes near or at a support level and followed by a big bull candlestick bigger than the entire body of the bear candle. We call that a bullish engulfing pattern and it means the bulls are back in charge!

The white, bullish candlestick’s body completely covers/engulfs the black bearish candlestick.
7. Bullish Concealing Baby Swallow
Unlike what you might think based on previous patterns, this four candle formation does not include a bullish candlestick. The four candlesticks are all bearish, three of which are Marubozu candlesticks. Marubozu candlesticks are what we call long candles, black or white, with little or no shadows.
This pattern starts with two in a row Marubozu candles that are followed by an inverted bearish hammer. The last candlestick, the last Marubozu, engulfs the previous inverted hammer candle and its shadow. This indicates that the sellers did not manage to push the price to lower levels, and that bullish support is present.
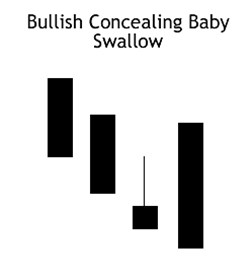
Notice how the bearish inverted hammer, third candlestick, is engulfed by the last Marubozu.
Bullish Reversals – Confirm them with Support!
These seven different bullish reversal candlestick formations should only be considered valid in downtrends. Further confirmation is absolutely required prior to considering any of the above formations a true signal such as occurring near a support level. You will notice that some of them rarely turn up on your charts so waiting for one to show can be tedious, this is why you need to know them all so when they appear you will be able to trade on them. Others, like the engulfing pattern, could show up repeatedly and on different time frames during the day. Take your time, carefully look through your charts as an exercise to see if you can notice any of the patterns you have learned in this article. Just remember, the textbook formations and real market conditions can be different which is why we call it analysis, you have to analyze support levels and trends, then look for reversals.
Further Reading On Japanese Candlestick Signals
- Bullish Continuation Patterns
- Bearish Continuation Patterns
- Bearish Candlestick Reversal Signals
- The Doji Signals