Harnessing the Power of Divergence for Binary Options: As Easy as Up or Down
Full Review of Stochastic Divergence on Auto Pilot for Binary Options
Maybe you’ve heard me talk about Divergence before and if you did, you probably also heard me say that it’s too complicated for most Binary Options traders. Let’s be honest here: if Binary Options are your first contact with the trading world, you are probably led to believe that trading the financial market is a piece of cake. That’s what the aggressive marketing wants you to believe and that’s how brokers attract new clients who are not familiar with the difficulties of trading. But we’re not here to talk about that and instead, I’m gonna show you a free tool that detects Divergence automatically.
How to use the Stochastic Divergence Tool
First of all you should know that this particular tool was created for Meta Trader 4. It will not work on other platforms so don’t bother trying. Divergence appears when an oscillator doesn’t move similar to price. As you know, price moves in waves and oscillators are meant to replicate those waves, offering some sort of information about future direction. But sometimes the indicator is not in tune with price, meaning that price makes a wave which is not shown by the indicator or the wave of the price is higher (or lower) than the one made by the indicator. Look at this picture:
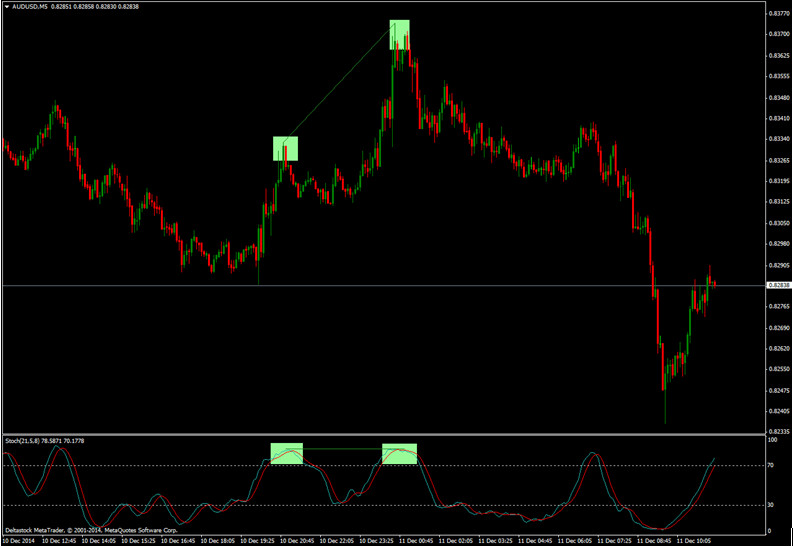
The Stochastic is just showing a double top although price is clearly making a higher high. The magnitude of price movement is different than the one of the Stochastic. That is called Divergence and there are 4 types: Regular Bullish, Regular Bearish, Hidden Bullish and Hidden Bearish. Each type comes with its own rules and if you want to know them, you should read this article: Divergence – The reversal and continuation tool.
I admit that recognizing Divergence can be a bit confusing and that’s where this tool comes in: it finds divergence on your chart automatically and prints arrows showing you the predicted direction. You don’t have to memorize all the rules because the arrows only appear when those rules are met:
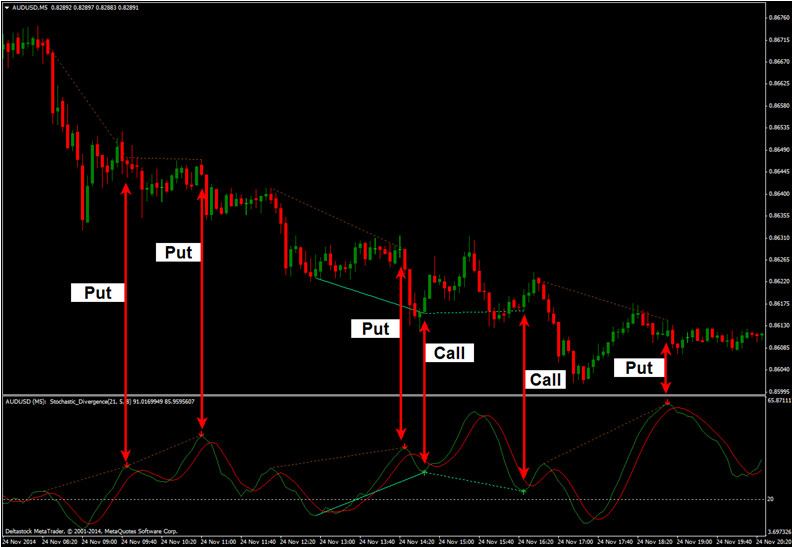
Basically all you have to do is forget about trying to identify Divergence and just wait for the indicator to print an arrow. If that arrow is pointing Down, there are increased chances for price to go Down and if the arrow is pointing Up… you guess what happens. It doesn’t get any simpler than that: a Down arrow means either Regular or Hidden Bearish divergence has been identified and an Up arrow means either Regular or Hidden Bullish divergence is present.
Tips and Tricks
- You can change the settings of the Stochastic. Using lower settings (say 5, 3, 3) will make it very fast and divergence will be present all over the place. This will increase the number of signals but will lower the accuracy. The opposite applies for a slower Stochastic.
- I wouldn’t recommend using Divergence and hence this tool on a lower timeframe than 15 minutes.
- Although Divergence is a powerful tool, going against a strong trend is not recommended. However, you could get an ITM if you catch the beginning of the retracement and use a short expiry time (1-3 candles). Check out the two Call trades in the pic above: those are counter trend but still end up ITM if the expiry is short.
- If Divergence appears when the Stochastic signals an extreme condition (overbought or oversold), the chances of In the Money trades increase.
- Use additional indicators such as a slow Moving Average for trend recognition and a faster MA for confirmation of the trade (i.e.: before entering a trade, price should move above/below the fast MA once Divergence is identified).
Why does the Stochastic Divergence tool Suck?
A while back I wrote a review about a tool that automatically draws Support and Resistance levels. Here it is if you want to refresh your memory: Full Review of the Support Resistance Tool for Binary Options. All these auto tools have one thing in common: they don’t identify the thing they have to identify as well as a human would do. Sometimes the Stochastic Divergence draws lines where they shouldn’t be drawn. It’s not a major issue and it doesn’t happen often, but don’t follow the indicator blindly; check to see if Divergence is really there.
Why the Stochastic Divergence doesn’t Suck?
The fact that this tool gives the trader a “heads-up” on divergence is the main reason why it doesn’t suck. I don’t like to trust any “auto” tool completely and I always check to see if the signal given by it was real or just a software fluke, but sometimes it’s hard to compare Highs and Lows for 12 or more pairs while keeping an eye out for other indicators as well, so an arrow comes in handy.
The Bottom Line for the Stochastic Divergence Auto tool
I’ve said many times that Divergence is a very important tool and the indicator presented in this article allows any newbie to use its power. It is not 100% accurate but even if you would learn to identify Divergence by yourself, I am sure in the beginning you would make more mistakes than this indicator does. Overall, this is a compromise that allows you to add Divergence to your analysis even if you don’t take the time to learn all the types of Divergence and all its rules.
Download Available:
- Stochastic_Divergence MTF Download Here