Dynamic Zone RSI – The Forgotten Binary Options Gem?
Full Review of the Dynamic Zone RSI Tool
I am actually excited to have found this tool… again. I say again because it has been sitting on my PC for a few years now. It was a time when it was always on my charts but it got lost in the multitude of other indicators or maybe I pushed it aside during my attempts to find the Holy Grail. I have no idea but anyway, I found it again and this article is all about it – the Dynamic Zone RSI.
What is it?
It’s a Relative Strength Index combined with volatility bands. As simple as that. Nothing magic or never heard before, but sometimes the simplest tools are the best. By default the RSI setting is 5 but I consider that too fast so I use the more common setting of 14 periods. As for the volatility bands, they are set at 30 by default and I didn’t mess with that. Here’s how the indicator looks like, compared to a normal RSI:
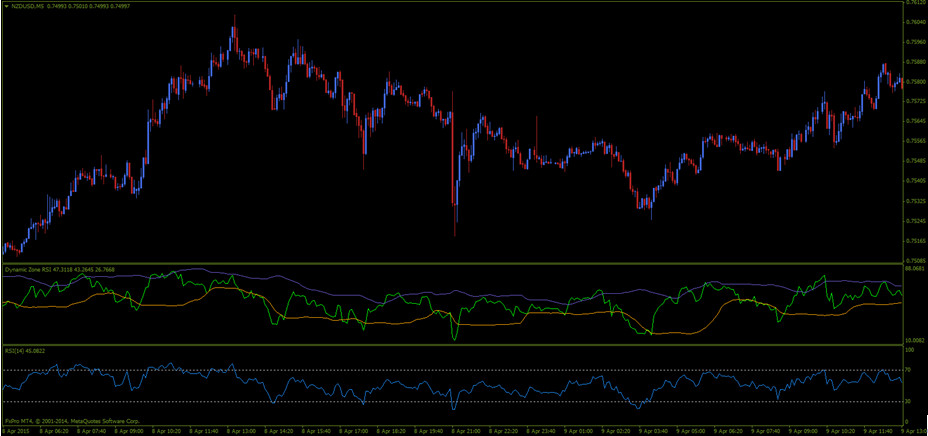
You’ve probably figured it already but the bottom RSI is the normal one and the top RSI is Dynamic Zone. If you look carefully you will spot some minor differences but overall they are almost like identical twins. Of course we have to talk about the elephant in the room: the two volatility bands. What is their purpose? Why not use the 70 and 30 levels like everybody else? Well, the answer is in the picture below:
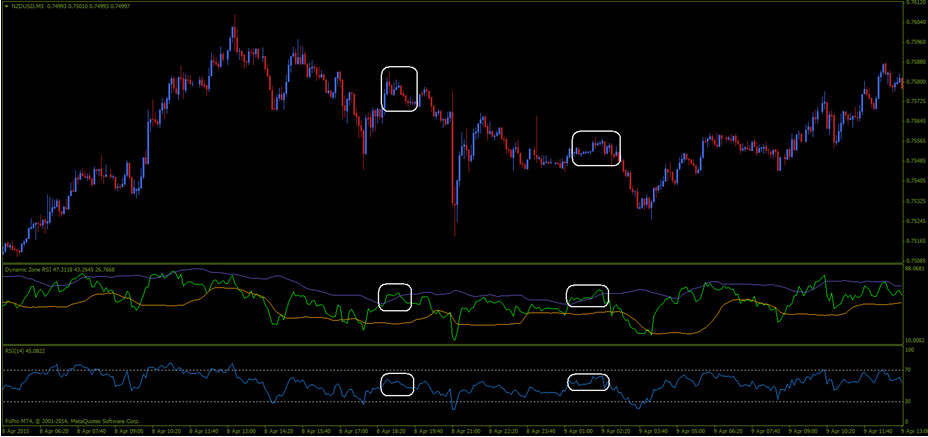
The volatility bands act as overbought and oversold levels but they adapt to the market’s volatility. This means that the Dynamic Zone RSI will signal overbought or oversold at places where the normal RSI will not be above 70 (overbought) or below 30 (oversold). Now look at the pic again. Twice the Dynamic zone RSI went above its upper volatility band, signaling overbought but the classic RSI did hot even touch the 70 level. Here’s how I see things: sometimes a currency can be overbought or oversold even if 70 or 30 hasn’t been touched because the market has different “speeds”. Sometimes it’s fast, sometimes it’s slow. When price moves strongly it is more likely to reach 70 or 30 than when things are calm. The role of the volatility bands is to show you when a currency is at an extreme (overbought or oversold) relative to current market conditions. In my opinion this indicator gives more importance to the current situation and is more versatile than the classic RSI simply because it can adapt.
Keep in mind that we are not talking about a strategy and the Dynamic Zone RSI shouldn’t be used on its own. However, in my opinion, a valid entry is identified when the RSI touches the upper or lower band or when it goes outside one of them and then reenters. I never used it as a standalone indicator, meaning that I didn’t take trades based solely on its signals and I don’t recommend using it exclusively, without other confirmation.
Why the Dynamic Zone RSI Sucks
Because the bands adapt and always move together with the RSI, you will get a lot more signals than with the normal RSI. Now, is that a good thing? Not always, because more signals means more risk. Of course, if you integrate this indicator into an amazing strategy with an excellent win rate, then you’ll want as many signals as possible, but we all know how hard it is to find that kind of strategy.
Why the Dynamic Zone RSI doesn’t Suck
I’ve seen a ton of Binary Options strategies based on Bollinger Bands and the volatility bands used by this indicator are very similar to Bollinger’s indicator. The movement of the RSI is derived from price and tries to eliminate some of the “noise” of the market and I believe it succeeds to do so. If you pay attention to other stuff (like the angle of the channel created by the bands or support and resistance levels), I believe you can incorporate this indicator into a successful strategy.
Wrapping it up – The Dynamic Conclusion
The Dynamic Zone RSI is nothing special. It will not turn you into a market wizard overnight, nor will it make you rich. As I’ve said many times before, it’s not the indicator, it’s the trader. Some of the best traders out there use only a Moving Average or simply a naked chart and still make truckloads of money. This indicator is a good aid and it should be treated like one, not like the answer to all trading questions.
Download Available:
- Dynamic Zone RSI download here